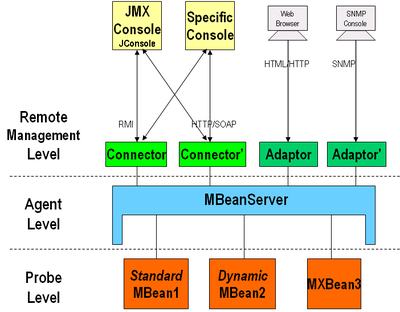
Java Management Extensions (JMX) is a technology for managing and monitoring Java applications. JMX instructs application developers how to instrument their applications to expose metrics and management mechanisms, and instructs operations teams how to collect metrics and manage Java applications. JMX is ubiquitous: there are a large number of off-the-shelf commercial and open source tools which speak JMX.
This article is intended for application developers to introduce JMX, to teach them how to create some simple metrics via JMX, and to encourage them to thoroughly instrument their applications with JMX.; This article uses only J2SE 5 and the Java Servlet specification. There may be better, more efficient, or more appropriate ways to add JMX counters to applications using other frameworks. For example, Spring developers should read http://static.springsource.org/spring/docs/2.0.x/reference/jmx.html.
Why to Instrument Your Application Using JMX
High-quality monitoring extends far beyond OS-level metrics such as CPU, memory, and disk space. Every non-trivial application has a collection of metrics which are critical to understanding how the application is behaving in production. There is no way for any off-the-shelf tool to collect these metrics, as they are internal to the application. Some examples of these metrics are:
- Cache hits and misses for an internal, in-memory cache
- Number of currently logged-in users
- Authentication successes and failures
Standardizing the way applications perform instrumentation allows us to easily integrate tools such as Graphite to enable rapid data aggregation, charting, dashboarding, and eventing. For example, the below custom dashboard was built in Graphite in less than an hour:

JMX for Application Instrumentation
JMX is a complicated technology which covers far more than just application instrumentation. However, this tutorial focuses on the basics of what an application developer needs to know to implement instrumentation for his application. If you would like to know more, please read the Java JMX tutorial.
To instrument an application, the developer must do the following:
- Write one or more Managed Beans, or MBeans, which are Java objects which contain the metrics that the application exposes
- Register the MBeans with the platform MBean server
A Standard MBean is defined by writing a Java interface whose name ends with MBean and a Java class which implements this interface. For example:
|
|
For the MBean to be visible to management applications, it must be registered with the platform MBean server. This is typically done with code that looks like:
|
|
MBeans may also generate notifications to signal state changes, detected events, or problems. This can be used to move from a polling to a push-based update mechanism. This is done by having the MBean class inherit from NotificationBroadcasterSupport and calling notify().
JmxCalcService – A Simple Web Application Instrumented with JMX
We will start with a simple web service called JmxCalcService which supports two URLs, add and subtract. These URLs are implemented by two separate servlets, com.morningstar.jmxcalcservice.servlet.AddServlet and com.morningstar.jmxcalcservice.servlet.SubtractServlet.
Here is the implementation of AddServlet (SubtractServlet is virtually identical):
|
|
These servlets are bound to URLs using the WEB-INF/web.xml file:
|
|
JmxCalcService may be tested as follows:
|
|
View JMX Instrumentation Using JConsole
The JVM is already instrumented with JMX, and the Servlet container often is (although typically the instrumentation on the latter must be explicitly enabled). We can view this instrumentation using JConsole. Let’s start up the web service and then view its instrumentation. Be sure to start the web service first so that JConsole can find the process:
|
|
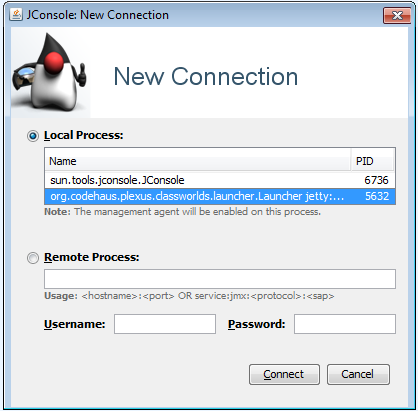
Find the Jetty process and click “Connect”:
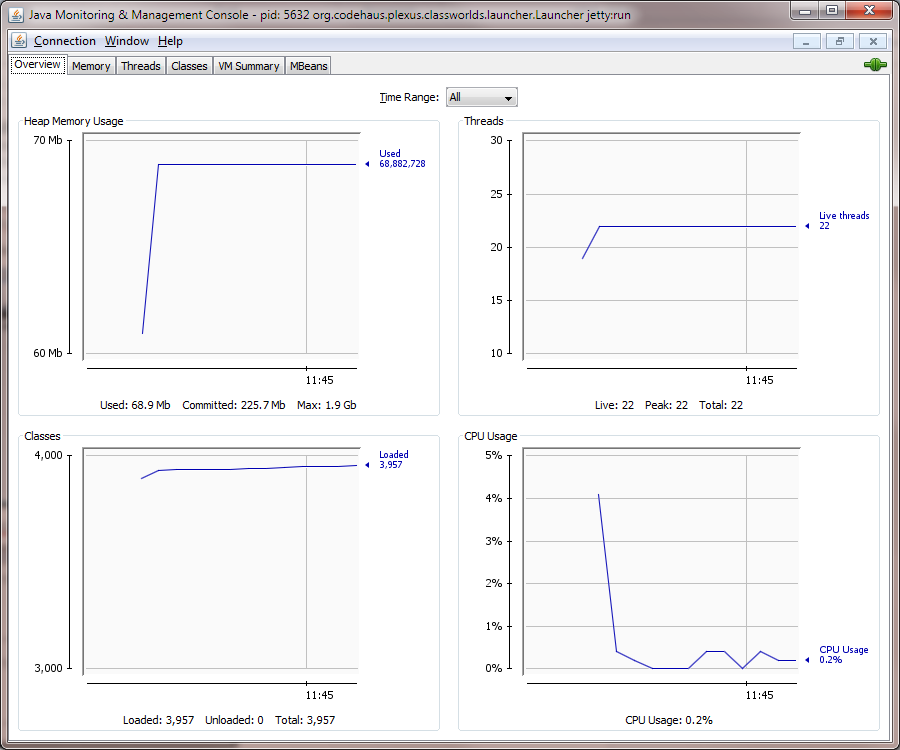
JConsole opens up a window which is updated in real-time with the state of the application:
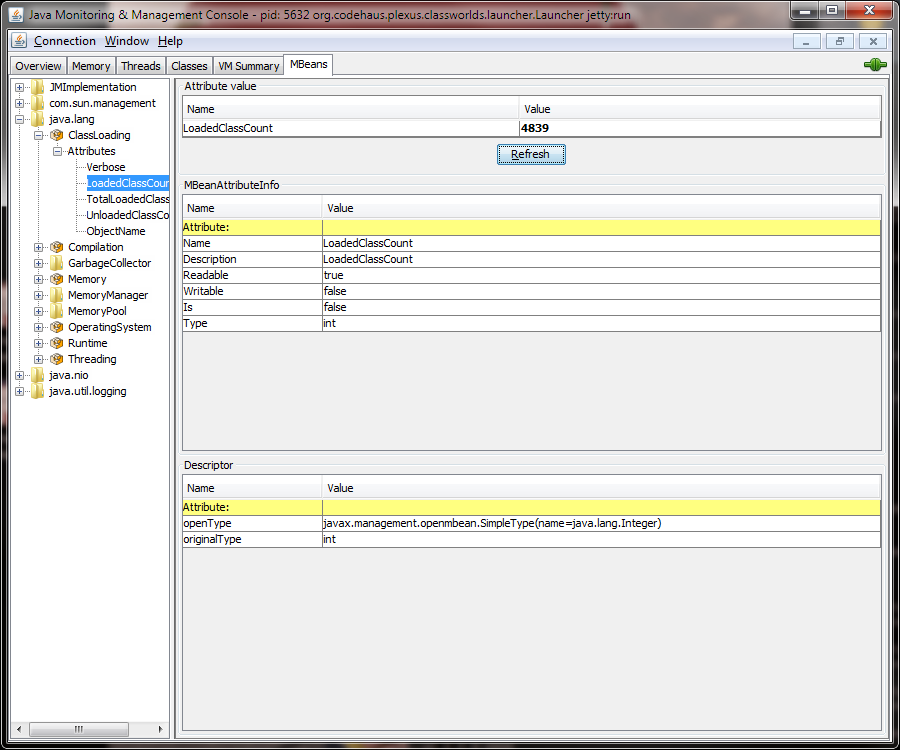
You can view individual MBeans by clicking on the MBeans tab. For example, we can view the value of the java.lang.ClassLoading.LoadedClassCount attribute as follows:
Adding Metrics to JmxCalcService
We will add two metrics to JmxCalcService: the number of times that add is called, and the number of times that subtract is called. These metrics will be implemented in a MBean whose interface is called com.morningstar.jmxcalcservice.mbean.JmxCalcServiceMBean:
|
|
The implementation of the MBean is in the class com.morningstar.jmxcalcservice.mbean.JmxCalcService This class also includes two additional functions, incrementNumAdds() and incrementNumSubtracts() These functions are called by the servlets each time their methods are called. These functions are not exposed through the MBean interface and are not available to JMX management applications.
JmxCalcService is implemented as a Singleton with thread-safe counters, as we only want one instance of the data and increments can happen on any thread. It’s implementation as below:
|
|
The JmxCalcService MBean must be registered with the platform MBean server. The proper way to register MBeans varies based on application type or servlet container. For Jetty, the following technique works well:
First, create a ServletContextListener which registers the MBean at application startup time and deregisters it at application shutdown time:
|
|
Second, add JmxCalcServiceContextListener to the web.xml file:
|
|
We must also change AddServlet and SubtractServlet to call incrementNumAdds() or incrementNumSubtracts() at the end of the function:
|
|
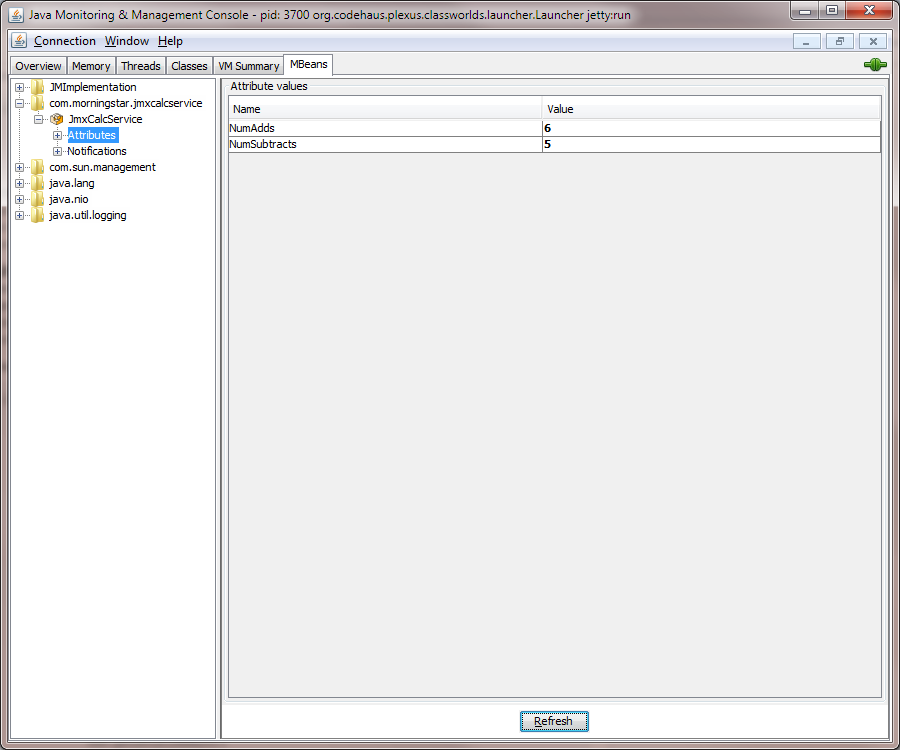
After all this, we can start the application, hit the URLs a few times, load JConsole and see the values:
What’s Next
After you instrument your application with JMX, consider hooking up your application to your centralized monitoring system or using jmxtrans to collect and send metrics to Graphite so that you can chart and trend data over time. Of course, if Graphite is your ultimate goal, statsd might be a better choice.